
A Labour Party that was in favour of remaining in the EU should keep this position, despite the referendum result. Thoughts here.
Author Archives: kwhelan
Flat Tax Calculations for Ireland
Flat tax systems, featuring a single rate and the elimination of tax breaks, have a lot to be said for them. They allow for the reduction of marginal tax rates and thus increase incentives for employment and discourage tax avoidance. And despite misconceptions related to the “flat tax” terminology, these systems can be made as progressive as you like via the introduction of a tax credit or tax-exempt allowance. In addition, many of the tax breaks that are eliminated are designed to benefit the wealthy. I’ve written about this before, highlighting that it is possible to combine a flax tax system with progressivity.
Given the potential benefits of a flat tax system, I’m glad that RENUA, one of Ireland’s new political parties, has proposed a such a system (see here and here) as it may lead to a constructive debate about what we want from our income tax system.
As with most economic policy proposals, however, the devil is in the details, and an examination of the evidence suggests some of RENUA’s claims about its flat tax proposal are over-egged and that the headline rate proposed would radically increase inequality.
Supply-Side Over-Egging
RENUA are proposing a 23% flat tax rate, supplemented by a basic income policy in which people are guaranteed an income of €8000. The first problem with the proposal is that it is likely to raise far less revenue than the current system. RENUA’s statement discusses this as follows
Our conservative projections across the income bracket show that this rate of tax will generate approximately 75%-80% of the existing income tax head of taxation. As people will retain 77% of their current income and of any additional income they earn on top of this, secondary factors and multiplier effects will generate more than the remaining 20% of the current rate of collection.
Anyone who follows fiscal policy debates in the US will probably be aware that this kind of “dynamic scoring” of tax proposals is a famously thorny issue (a “can of worms” according to Harvard’s Greg Mankiw). However, in examining this literature (see this presentation for example) it is clear that a 20% boost to revenue collection is well above the usual range of estimates for what can be expected from tax reforms.
Overall, I think the best approach when introducing proposals of this type is to show how they can raise the same amount of revenue as the current system under current economic conditions and then to argue that there will also be a positive but uncertain boost from supply-side effects.
Impact on Inequality
To understand the impact of flat tax proposals, it is necessary to have a fully-worked example that shows how households in every part of the income distribution will be affected and how the taxes raised add up to match the revenue of the existing system. As far as I know, RENUA have not provided these calculations but I have put together a spreadsheet using data from the Revenue Commissioners to illustrate two different types of flat tax system. My conclusion is that any system that features a 23 percent tax rate and raises the same revenue as the current income tax and USC combined will be sharply regressive in its impact on income distribution.
To do these calculations, I used income distribution statistics from the Revenue Commissioners. The figures show numbers of tax payers in various income bands, the total amount of income they earned and the amount of tax they paid. Specifically, I use the table that shows the combined amounts of income tax and USC paid by various groups.These are in the tab labelled “Basic Data”. The figures I use are from 2011 and are from the 2012 “Statistical Report”, a publication that the Revenue appear to have discontinued. While it would be nice to have more recent data, the figures are sufficient to model the effect of tax reforms in a realistic manner.
See below for a summary of the tax paid by various groups in 2011. I have aggregated data on single-earner and double-earner married people as well as various classes of single people to keep the figures as simple as possible.

A couple of aspects of these calculations are worth emphasising. First, Ireland’s income tax system is extremely progressive with very low average tax rates for people at the lower end of the income distribution. Single people earning under €20,000 and married couples earning under €30,000 both are taxed at a rate less than 5 percent.
Second, the figures show that the richest are shielding large amounts of money from income taxation. For example, the richest group of married people (those earning over 275,000) earn an average of just over €500,000 per year but pay an average income tax rate of only 39 percent. Given how much of their income is supposed to be taxed at a marginal tax rate of about 50 percent, this suggests a significant amount of shielding of otherwise taxable income.
The spreadsheet describes two different variants on the flat tax. The first variant has a single tax rate as well as tax-free exemption on the first portion of income earned. The second variant has a single tax rate and a specified tax credit that is available to all. I have assumed that married couples get a double tax exemption or double tax credit depending on which system is examined. The spreadsheet allows the user to enter their chosen tax rate as well as their preferred tax exemption or tax credit. It then shows the resultant tax rates for various groups and compares them with the current system (or more precisely the 2011 system, which was very similar). Finally, it calculates the total amount of tax revenue raised by the current and reformed systems.
For both the tax exemption and tax credit system, I have entered 23 percent as the flat tax rate and then adjusted the other aspect of the tax system so that the total amount of money raised more or less matches the current system. For the tax exemption system, the size of the tax exemption that allows the reformed system to raise the approximately same amount of revenue was €5,000. The table below shows the details. It is very small but (at least on my computer) clicking on it makes it bigger. The tax rates for those at the bottom end (apart from those earning under €10,000) would be significantly higher and tax rates for those at the high end would be significantly lower.

This table (from the the tab “Specific Examples”) reports the scale of income losses and gains to various groups.

The proportional gains at the top and losses at the bottom are very large. A move to a tax system of this sort would greatly raise post-tax income inequality.
Of course, the RENUA proposal is a bit more like the “tax credit” variant due to the guaranteed income of €8,000. In my calculation, the tax credit that allows a 23 percent rate to raise the same amount of revenue as the current system is only €1,140. It is possible, however, that this is somewhat consistent with RENUA’s plan because most of the money for their proposed guaranteed income would presumably come from the existing social welfare system. In any case, the tax rates from this tax credit system are basically the same as those from the exemption system.
A Fairer Flat Tax?
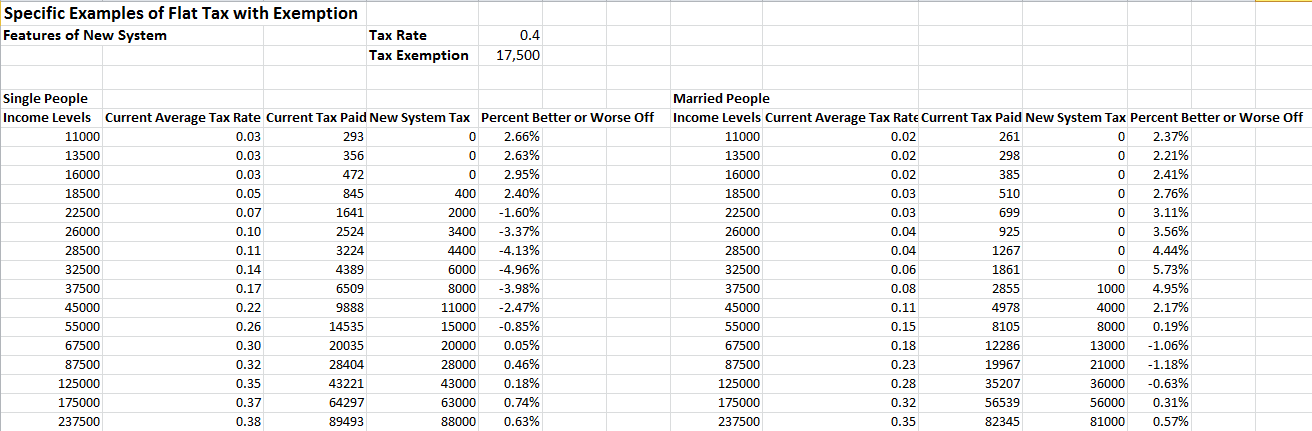
This doesn’t mean that flat taxes have to be innately unfair. For example, you can use the spreadsheet to show that a flat rate of 40% with a tax exempt allowance of €17,500 would raise as much as the current system and still be highly progressive. However, there will always be winners and losers from tax reform. A system of this sort would see married people with joint incomes under €50,000 register gains but they would take these gains from single people earning between €25,000 and €40,000.
 So no tax system is perfect or will be favoured by everyone. What this example does show, however, is that it is possible to have flat tax rate that is a lot lower than the current top marginal rate without having a significant increase in inequality. A system of this sort would likely have some positive effects in reducing tax evasion and could have some of the positive supply-side effects described by RENUA. However, the idea that we can have a headline tax rate of 23% without greatly raising inequality does not hold water.
Presentation on the Irish Economy
I gave a presentation today on the outlook for the Irish economy at the annual conference of the Regional Science Association International (British and Irish Section). The presentation was considerably more upbeat than many I have done in recent years but still discusses a number of important medium-term risks to the economy. Slides are here in PowerPoint form and here in PDF.
Alice In Schäuble-Land: Where Rules Mean What Wolfgang Says They Mean
Schäuble is working hard to undermine the deal that attempts to keep Greece in the euro area. And his key argument is pure fiction.
After The Greek No, What Next?
Here is a piece I wrote for Huffington Post on the implications of the Greek No vote.
From Greferendum To Grexit?
Some thoughts on what may happen after Greece’s referendum tomorrow.
ECB Decision Likely Means Greek Banks Stay Closed
Some comments on today’s ECB Governing Council decision to cap ELA for Greek banks.
The Grexit Mechanism: What It Means For The Future Of the Euro
A discussion of the mechanism that is potentially driving Greece out of the Eurozone and its implications for the future of the euro.
Greece, The Euro and Gunboat Diplomacy
Prior to Monday’s umpteenth “summit to beat all summits”, some context on how we arrived at the current situation in Greece.
The FT Lets Itself Down Again: Francesco Giavazzi on Greece
There seems to be a new brand of op-ed at the FT. Formerly respected academics write crazy things about the euro crisis, particularly Greece. Some thoughts on a particularly nutty piece on Greece by Francesco Giavazzi.